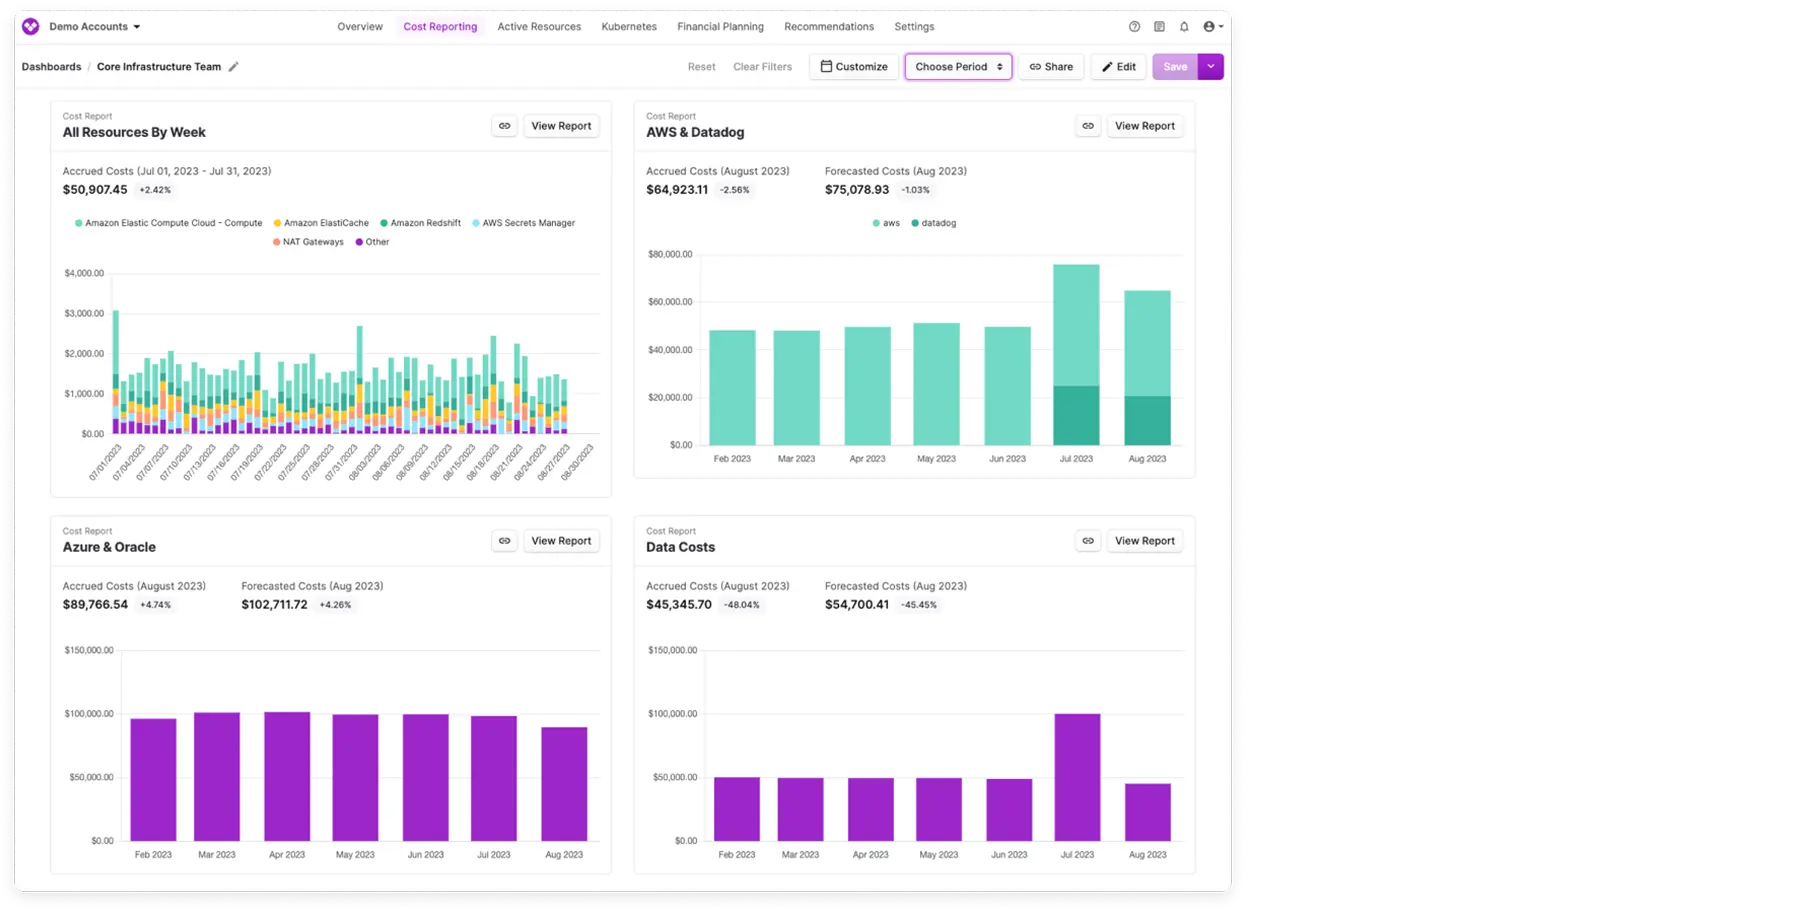
Cloud bills are killing your profit. You see the total amount rising, but you cannot see where the money is leaking, whether its idle resources, over-provisioned databases, forgotten dev environments, or something else.
This lack of visibility directly hits your EBITDA. For a mid-sized enterprise spending $2M annually on cloud, a 20% waste rate is $400,000. The cost of three senior engineers just vanished into thin air.
You need a tool that doesn’t just draw diagrams but also actively visualizes financial health and encourages saving. If Holori’s performance bottlenecks or limited enterprise reporting are slowing you down, this guide covers the 6 best alternatives to address these issues.
Core problem with Holori: It shows where the money is going, but can’t fix it. In 2026, with Kubernetes and multi-cloud setups, static diagrams become outdated and slow at scale.
What to look for instead: CFOs are looking for Speed, live data, execution, and ROI; tools that either automate savings or provide better financial intelligence.
Top Holori alternatives
Holori made a name for itself by combining FinOps cost data with infrastructure diagrams. However, as cloud environments scale, three specific limitations are forcing teams lean toward specialized alternatives.
Holori is excellent for creating a snapshot of your infrastructure for documentation. But in dynamic Kubernetes environments where pods spin up and down every minute, a static diagram is often obsolete by the time it renders.
Teams need real-time, live execution, not just a historical record of what the cloud looked like an hour ago.
Holori identifies anomalies visually (e.g., This red box is expensive). However, it lacks the Agentic capability to fix them. It relies on humans to interpret the diagram and take action.
Competitors, like costimizer, now offer Autopilot modes that resize or terminate resources with minimal human intervention.
User reviews indicate that as infrastructure grows to thousands of nodes, diagram generation can become sluggish. Large enterprises often find that visual tools are hard to render complex multi-account environments without significant lag, making them less useful for quick troubleshooting.
Below is a breakdown answering common technical questions for decision-makers.
Feature / Question | Costimizer | Holori | Lucidscale | Hava | Cloudcraft |
Primary Focus | Agentic Execution | Cost & Diagrams | Cloud Visualization | Automated Diagrams | AWS Diagramming |
Actionable Savings? | Yes (Automated Fixes) | Recommendations | No (Visuals only) | No (Visuals only) | No (Visuals only) |
Guaranteed Savings? | Yes | No | No | No | No |
Multi-Cloud? | AWS, Azure, GCP | AWS, Azure, GCP | AWS, Azure, GCP | AWS, Azure, GCP | AWS Only |
Mobile Access? | Yes | No | No | No | No |
Best For... | Reducing the Bill | FinOps & Docs | Architecture Audits | Security/Compliance | AWS Design |
Pricing Model | % of Spend | Flat SaaS Fee | Per User License | Flat SaaS Fee | Per User License |
Deep Dive on Integration Capabilities:
Alright, let’s see each one in detail.

Best For: Guaranteed Savings & AI-Driven FinOps Automation
Type: Agentic Cloud Management Platform
Costimizer has positioned itself as more than just a reporting tool; it also acts as an autonomous Cost Guard for your cloud.
While Holori focuses heavily on the diagram aspect of infrastructure, Costimizer focuses on the financial outcome of that infrastructure.
The Core Difference: In one word its Guaranteed Outcomes. Most tools sell you software and hope you use it correctly. Costimizer offers a unique model that guarantees savings.
This shifts the risk from you (the buyer) to them (the vendor). If the tool doesn’t find savings, the value proposition adjusts, making it a low-risk decision for CFOs.
Key Features for Decision Makers:
Integration & Accessibility:
Why it replaces Holori: If your primary goal with Holori was to view costs and reduce them manually, Costimizer makes this even easier: it can show you the cost and automatically reduce it.
Best For: Enterprise-grade cloud visualization and architecture audits.
Type: Cloud Visualization Platform
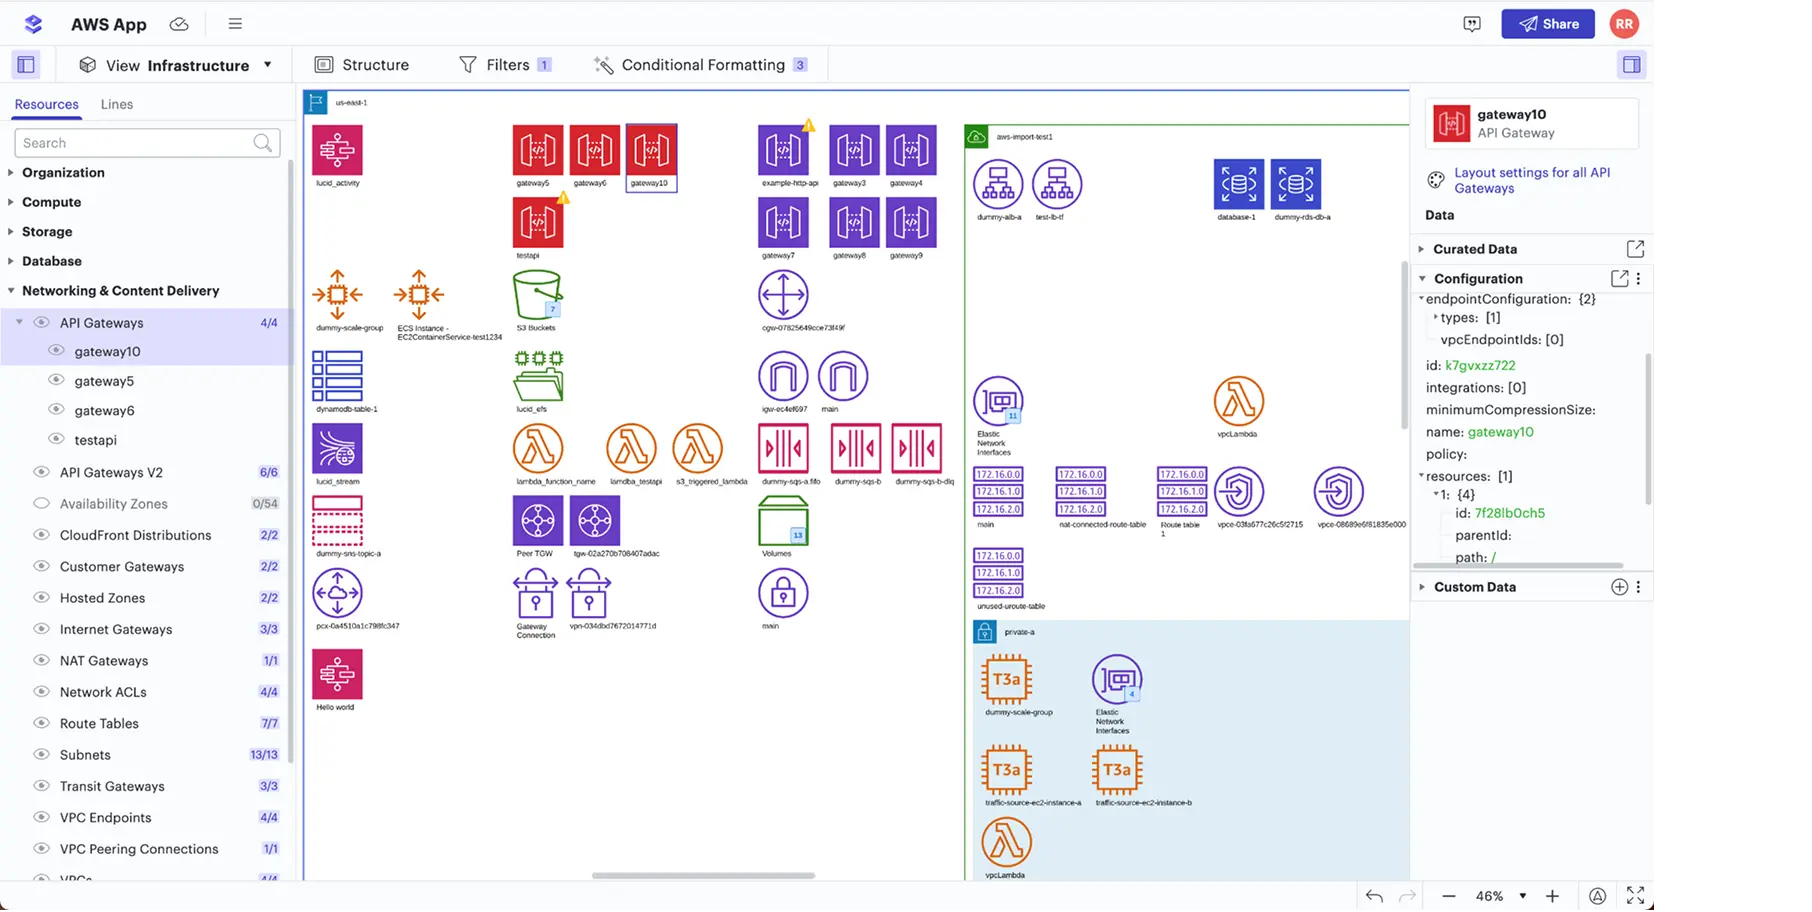
If you need Holori solely for its diagramming capabilities, Lucidscale is the market leader. It automatically generates diagrams from your cloud provider data (AWS, Azure, GCP) and allows deep filtering and customization.
Trade-off: It is purely for documentation and visualization. It has no cost optimization execution capabilities.
Best For: Automated documentation and security compliance.
Type: Automated Network Topology
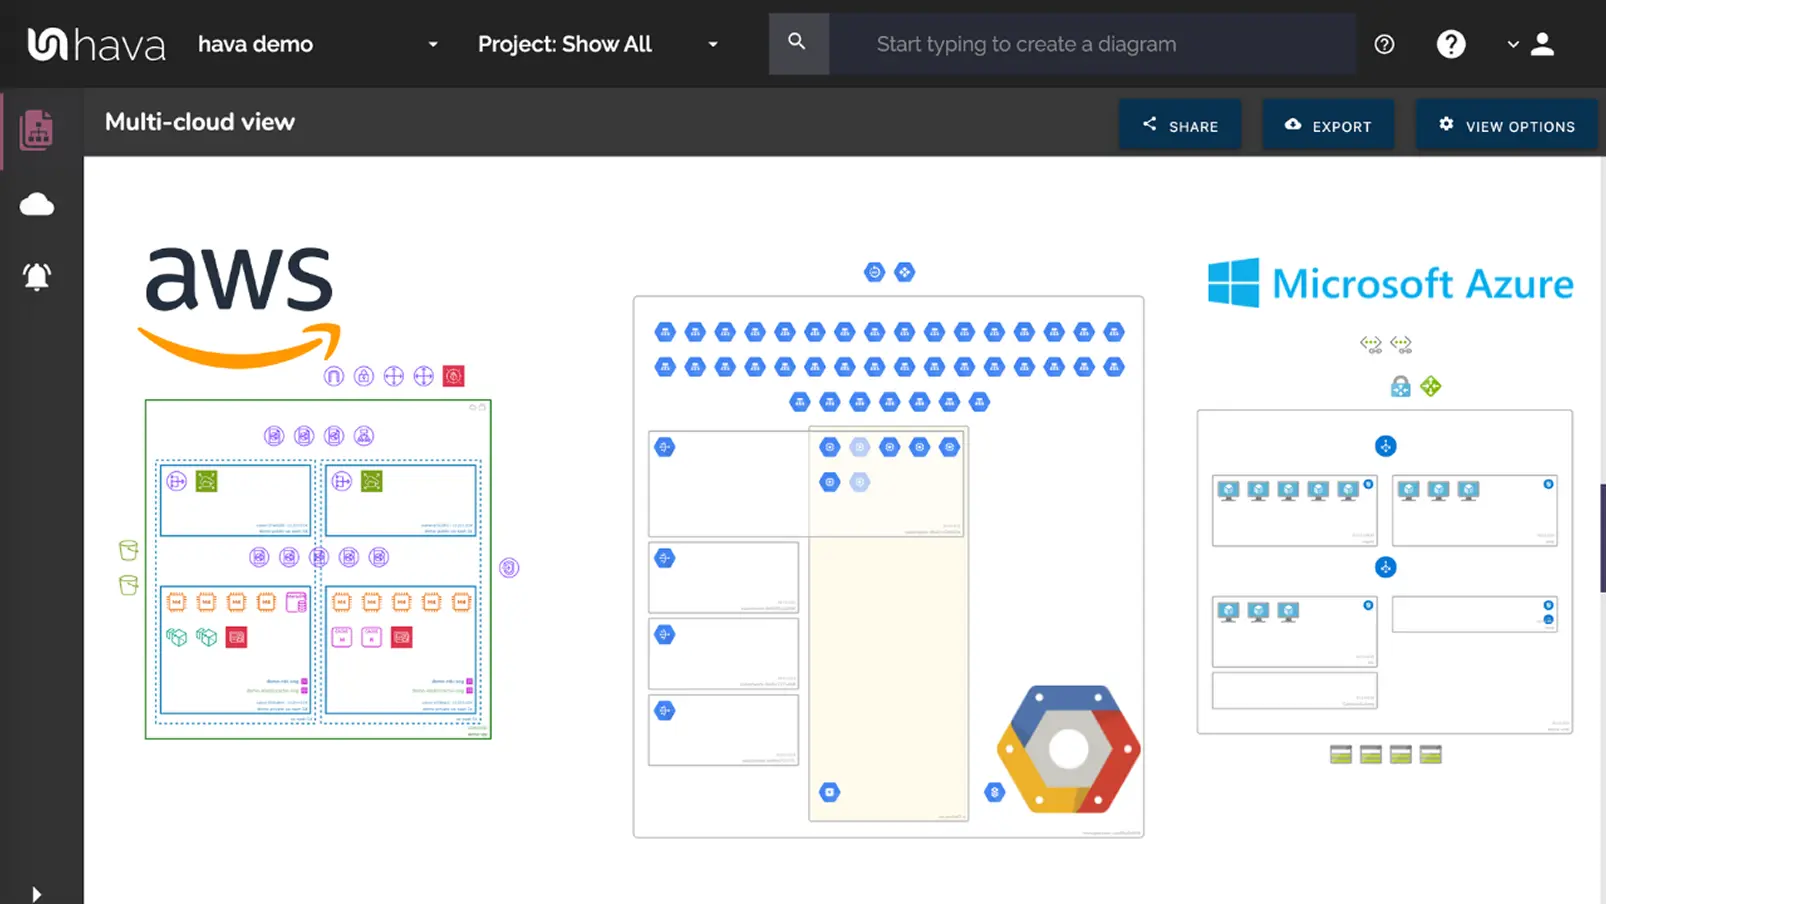
Hava focuses on hands-free documentation. It connects to your cloud and automatically generates interactive network topology diagrams. It detects changes and updates the diagrams in real-time, keeping a version history of your architecture.
Trade-off: Like Lucidscale, it is an observer. It cannot modify resources or reduce costs.
Best For: Designing AWS architectures (Design-first).
Type: Architecture Design Tool
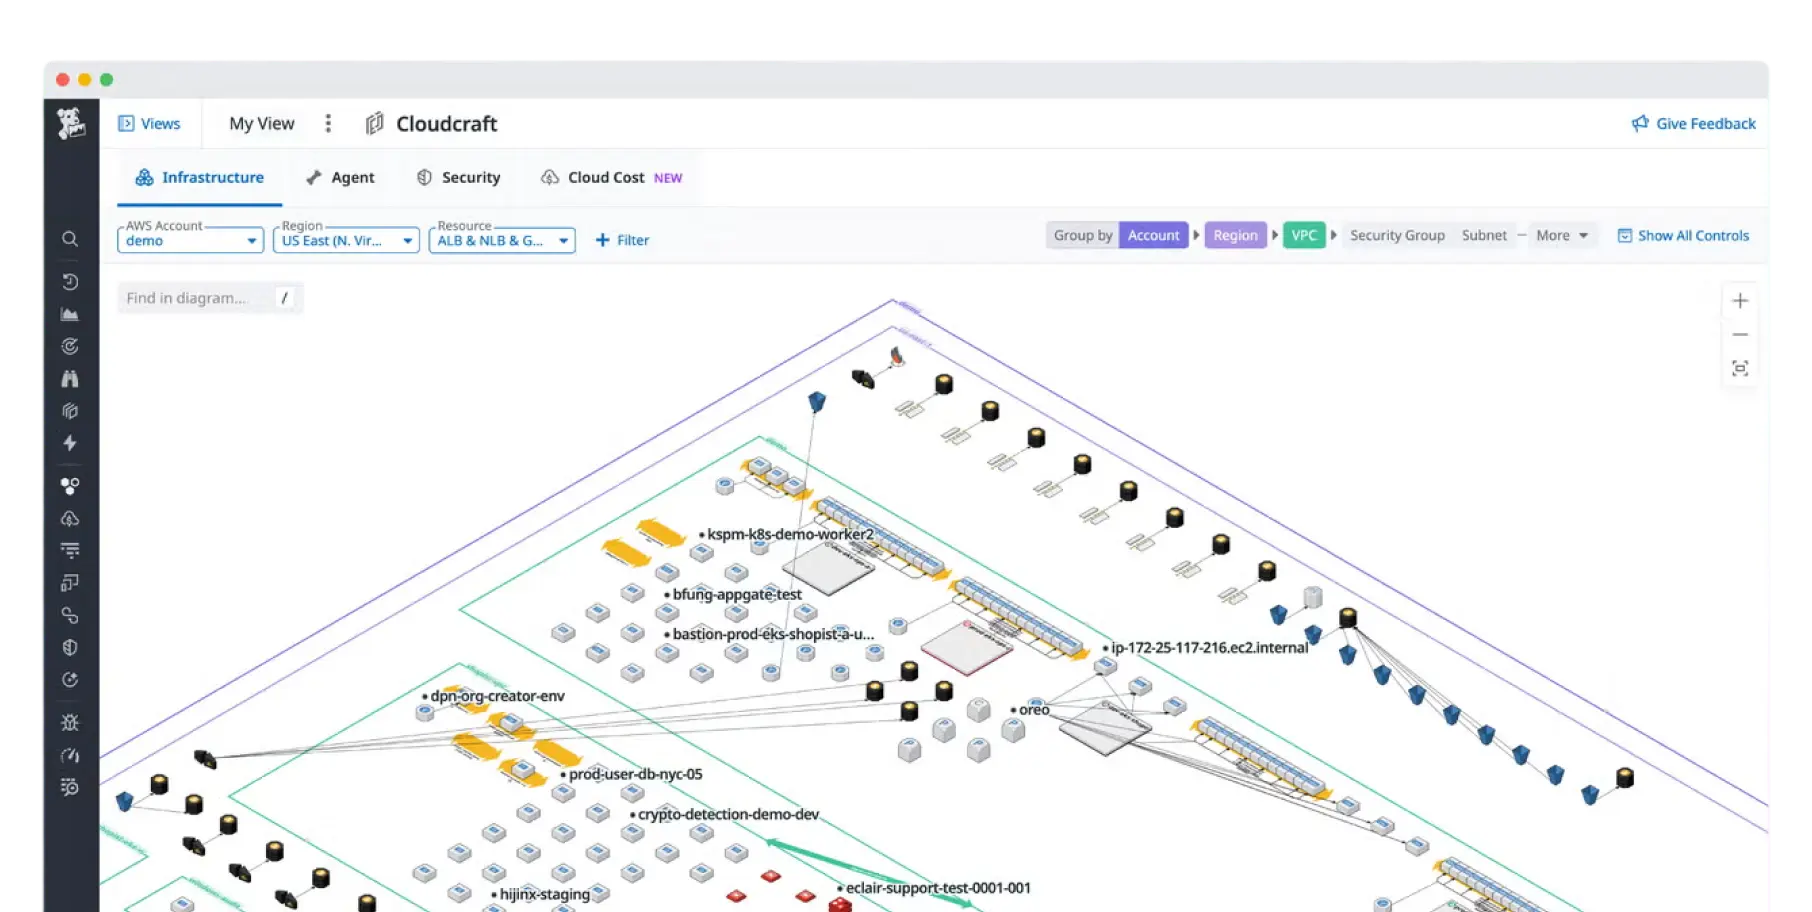
Cloudcraft (acquired by Datadog) is beloved for its beautiful 3D isometric diagrams. It is often used before infrastructure is built to estimate costs and design layouts.
Trade-off: Its multi-cloud support is weaker than Holori's or Lucidscale's, and it is less automated for existing, messy infrastructure.
Best For: FinOps reporting without the diagrams.
Type: Cloud Cost Management
If you used Holori for cost allocation rather than diagrams, Vantage is a stronger financial tool. It excels at multi-cloud reporting and Virtual Tagging to organize costs without changing infrastructure.
Trade-off: It does not generate topology diagrams. You get graphs and tables, not maps.
Best For: Infrastructure-as-Code (IaC) generation.
Type: CI/CD & Diagramming
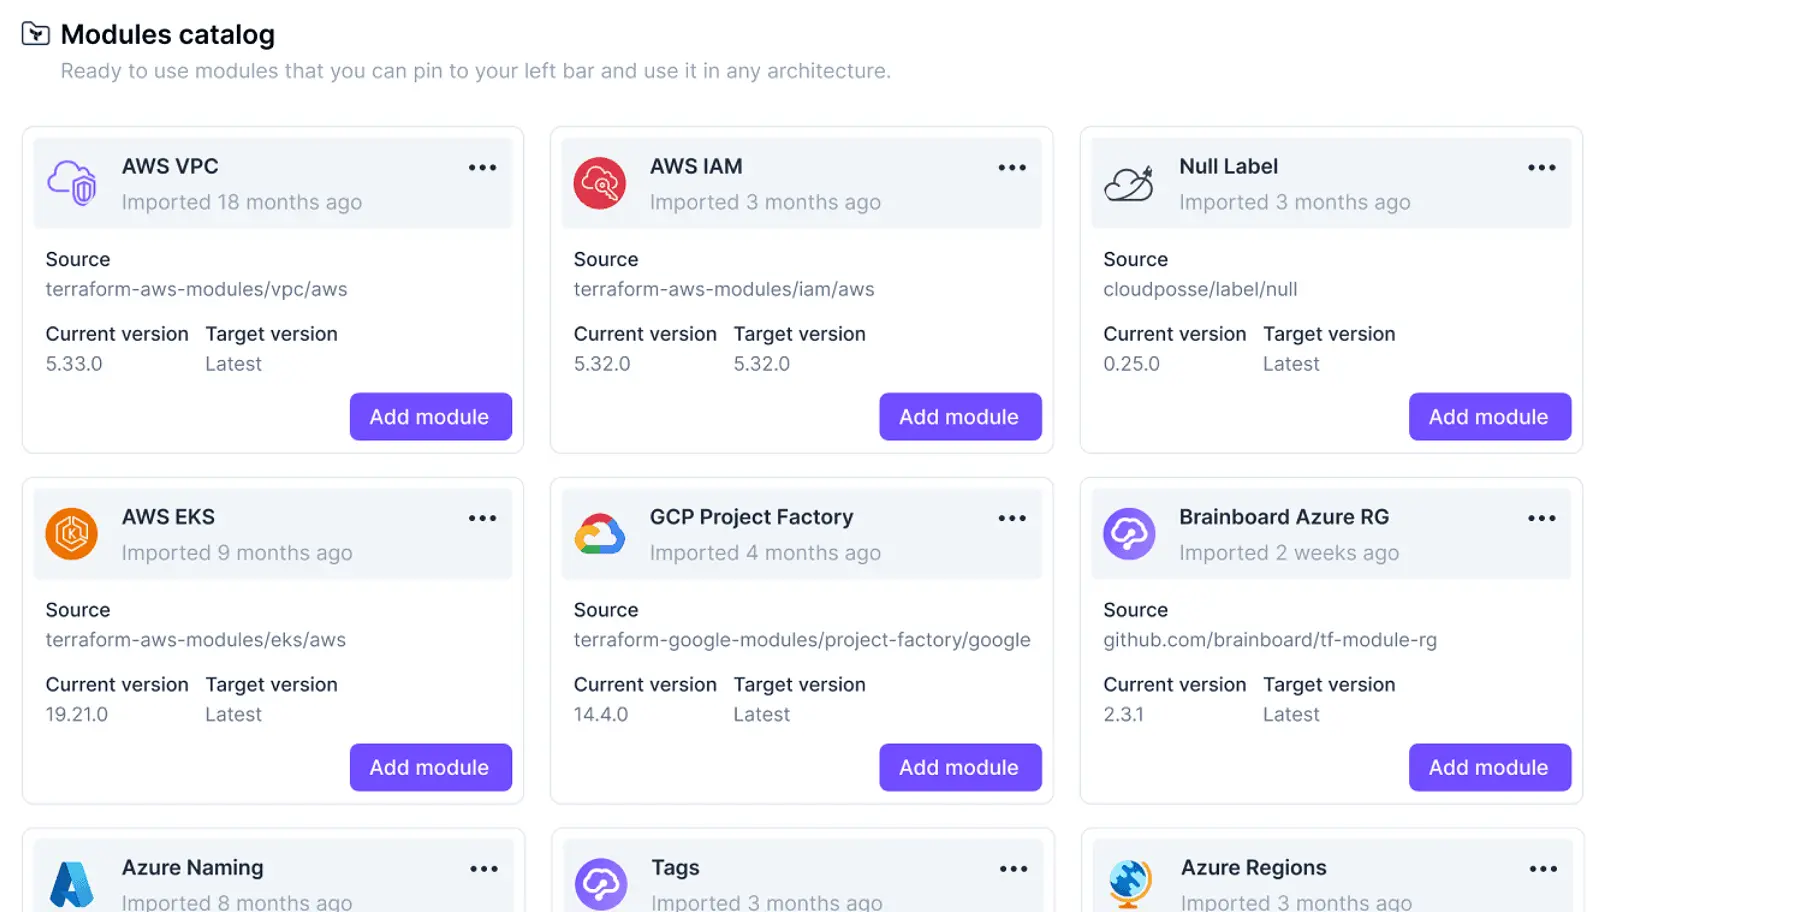
Brainboard lets you draw your architecture and then automatically generates Terraform code to deploy it. It reverses the Holori model: instead of diagramming what exists, you diagram what you want, and Brainboard builds it.
Trade-off: It is a deployment tool, not a cost-saving tool.
The best tool depends on the problem you want to solve, whether it is a Documentation problem or a Financial problem.
Here is the 3-Point Decision Checklist:
If you need a static map for a one-time compliance audit, Lucidscale is the industry standard.
If you are architecting a new AWS environment from scratch, Cloudcraft is your best design partner.
But if your actual problem is a cloud bill that bleeds profit, you don’t need another diagram; you need a Cost Guard. Costimizer is the only solution here that moves beyond passive viewing to active fixing. With its Agentic AI and guaranteed savings model, it doesn't just report on waste; it eliminates it.
Yes. Costimizer supports native exports to Snowflake, BigQuery, and S3, allowing you to combine cloud cost data with business metrics for Power BI or Tableau reporting. Holori has more limited export capabilities focused on PDF/CSV.
Yes. Costimizer operates on a performance-based model. If the platform does not reduce your cloud bill, you do not pay the first month's subscription fee. This contrasts with Holori’s flat monthly SaaS fee.
Yes. Costimizer provides robust APIs and webhook support. This allows you to trigger internal workflows (e.g., Jira tickets, Slack alerts) when a budget spike is detected or a diagram is updated.
Costimizer is excellent for SMBs. Costimizer’s performance-based pricing means zero upfront risk for smaller budgets, while Cloudcraft offers a low-cost entry point for simple AWS design.
Most diagramming tools (Lucidscale, Holori) have fixed integrations. Costimizer offers greater flexibility for integrating with custom CI/CD pipelines or internal developer portals via the API.
Costimizer prioritizes mobile access, offering optimized views that let executives approve savings actions or check spend velocity on the go. Holori and Lucidscale are primarily desktop-browser tools.
Yes. Costimizer follows a Zero-Root-Credential architecture and never stores cloud root credentials. All data is encrypted in transit using TLS 1.2/1.3 and at rest using AES-256 encryption.
For diagramming tools (Holori, Lucidscale), ROI is measured in time saved on documentation. For execution tools like Costimizer, financial ROI is typically realized within 30 days, as the AI begins actively shutting down idle resources.
•
CTO•
Articles