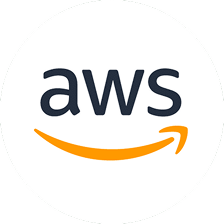
Costimizer is 100% free. We help you save on cloud like the big tech!Book A Demo
The Cloud Analytics Dashboard You Need

We have trained our AI models on years of FinOps expertise, so you know you're tracking the right metrics from the start. It's super easy to use: Just link all your accounts to see one unified cloud dashboard that clearly shows your costs, usage, and savings opportunities. TURN YOUR BIGGEST CLOUD COST INTO YOUR BIGGEST OPPORTUNITY

Start With AzureStart With AzureStart With AWS
Reach out to us! 👍
G2 Reviews
G2 Reviews
4.5/5 | 18k+ Happy reviews
G2 Reviews
G2 Reviews
4.5/5 | 18k+ Happy reviews

$100M+
Cloud Spend Managed
$100M+
Cloud Spend Managed

Up to 30%
Savings Uncovered for Teams
Up to 30%
Savings Uncovered for Teams

Trusted by FinOps
CTOs & Cloud Leaders Across 12+ Countries
Trusted by FinOps
CTOs & Cloud Leaders Across 12+ Countries
G2 Reviews
G2 Reviews
4.5/5 | 18k+ Happy reviews
G2 Reviews
G2 Reviews
4.5/5 | 18k+ Happy reviews

$100M+
Cloud Spend Managed
$100M+
Cloud Spend Managed


Up to 30%
Savings Uncovered for Teams
Up to 30%
Savings Uncovered for Teams

Trusted by FinOps
CTOs & Cloud Leaders Across 12+ Countries
Trusted by FinOps
CTOs & Cloud Leaders Across 12+ Countries

Get started with Costimizer todayintegrates with AWS, GCP, and Azure. Our setup connects accounts quickly. Once connected, our platform monitors cloud usage and expenses.
Read Documentation
documentation
Unlock More Ways To Save

This is how you finally control your cloud bill.

Costimizer gives you clear visibility and smart automation, but that’s just the start. Take a look at all the ways it can put money back in your budget.

All Features
FinOps Dashboards for Financial Tracking

Make your leadership picture as clear as day with our FinOps dashboard. We will provide you with simple KPIs to showcase your cloud budgeting, forecasts, and overall cloud financial health.

    All your key KPIs at one place, including the MTD/QTD/YTD spend and daily run rate, and the progress of your forecasts against budget.
    Get a detailed breakdown of your cloud bills by major dimensions such as Service, type of resource, region, or project.
    Visualize your day-to-day, weekly, and monthly spending habits to see your financial velocity and long term trends.

tracking

Technical Dashboards for Resource Optimization

We will provide you with simple KPIs to showcase your cloud budgets, forecasts, and overall cloud financial health through real-time FinOps Analytics.

    Determine idle or underused cases, receive computerized and memory rightsizing suggestions, and examine your Reserved vs. On-demand utilization- one of the most effective ways to learn how to reduce AWS cost.
    Identify unattached/orphaned volumes and receive automated recommendations on how to use lifecycle policies to transfer the data to less expensive storage classes such as Standard-IA or Glacier.
    Use our deep Cloud Spend Analytics to break down your data transfer bill by the type of traffic (In/Out, Inter-region, CDN) and identify areas for reduction.

Technical Dashboards for Resource Optimization

Governance Dashboards for Tag & Cost Allocation

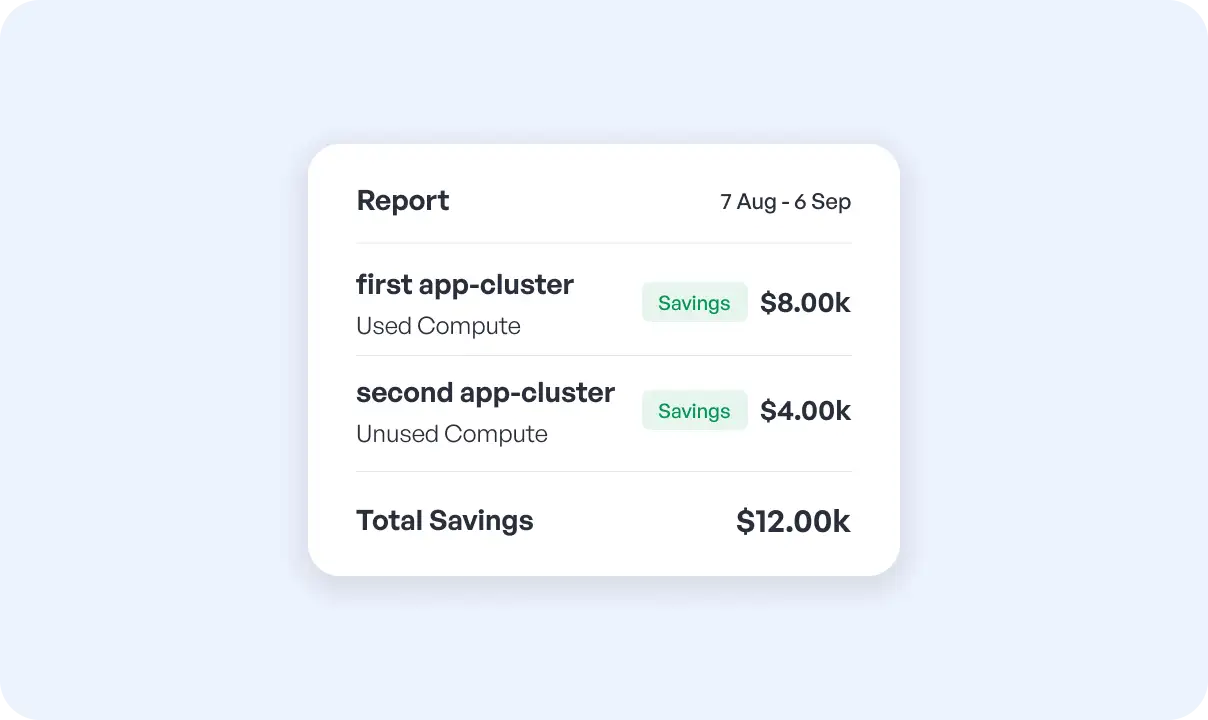
Financial control is based on good governance. These dashboards help you develop a culture of responsibility by applying the policy of tagging, ensuring every dollar is spent correctly.

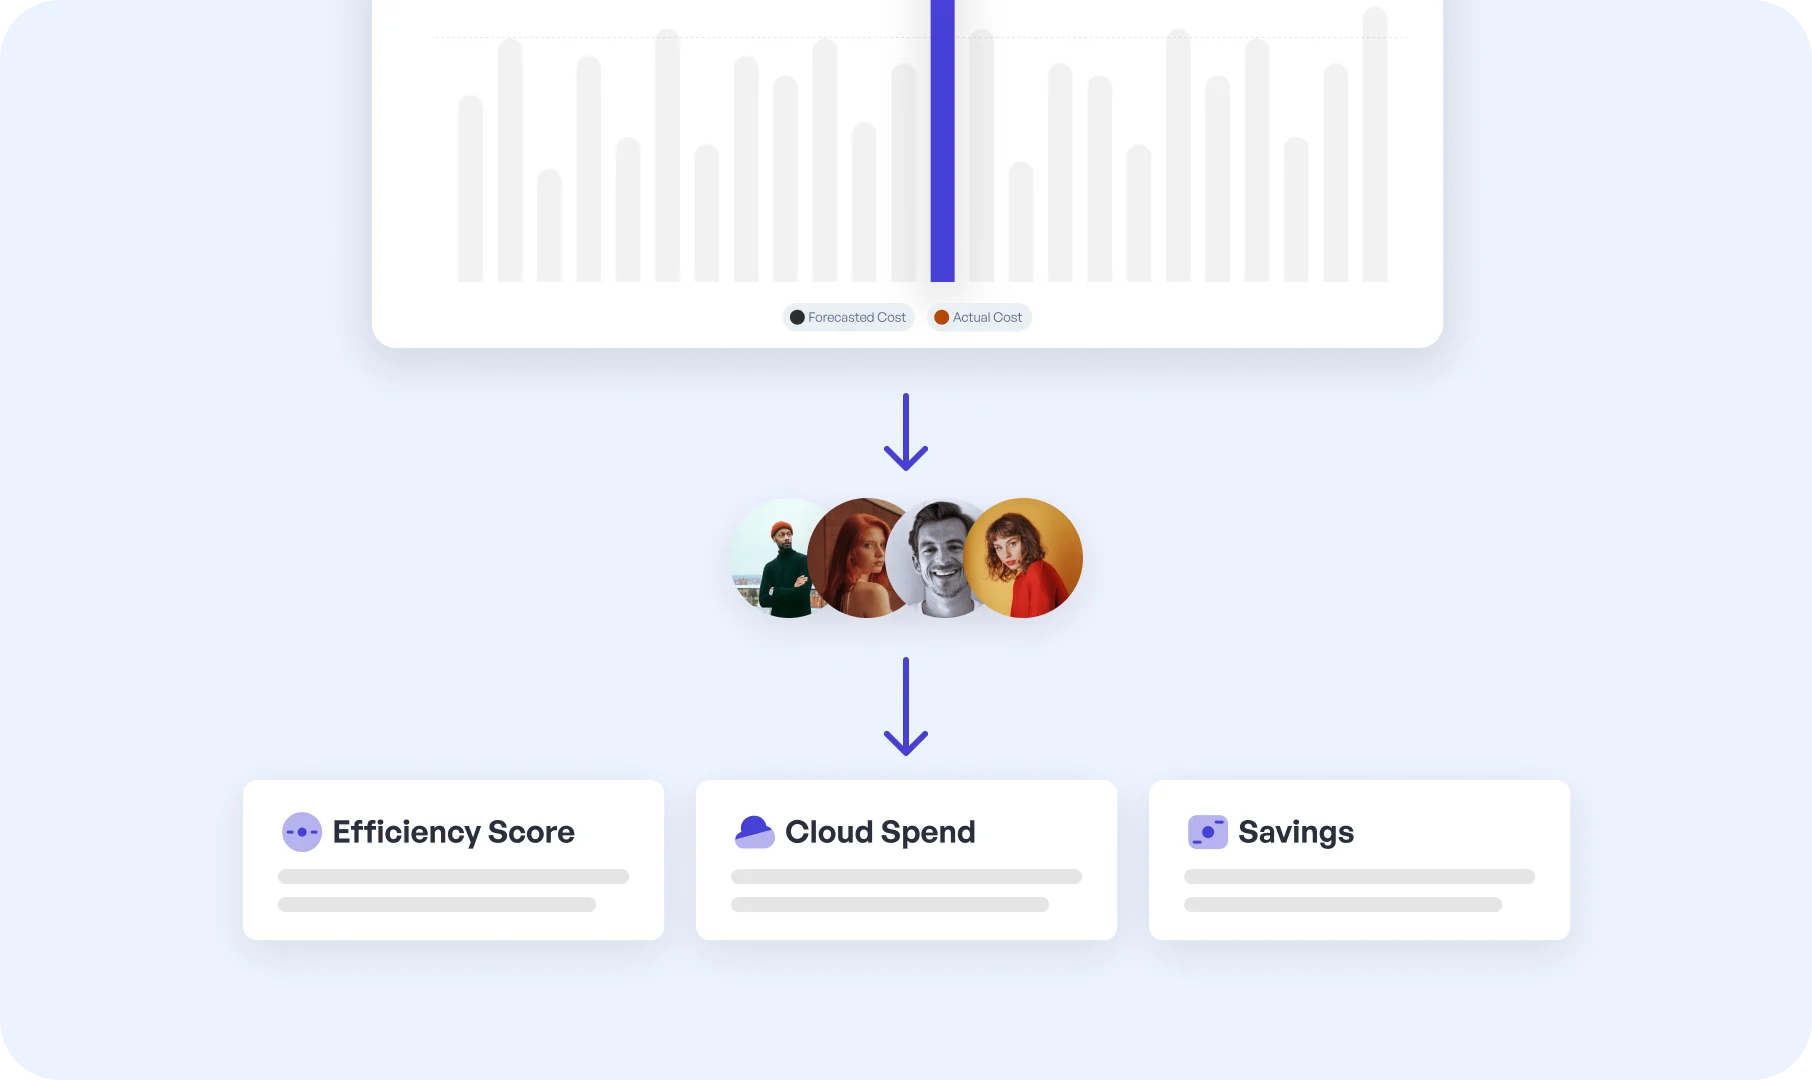
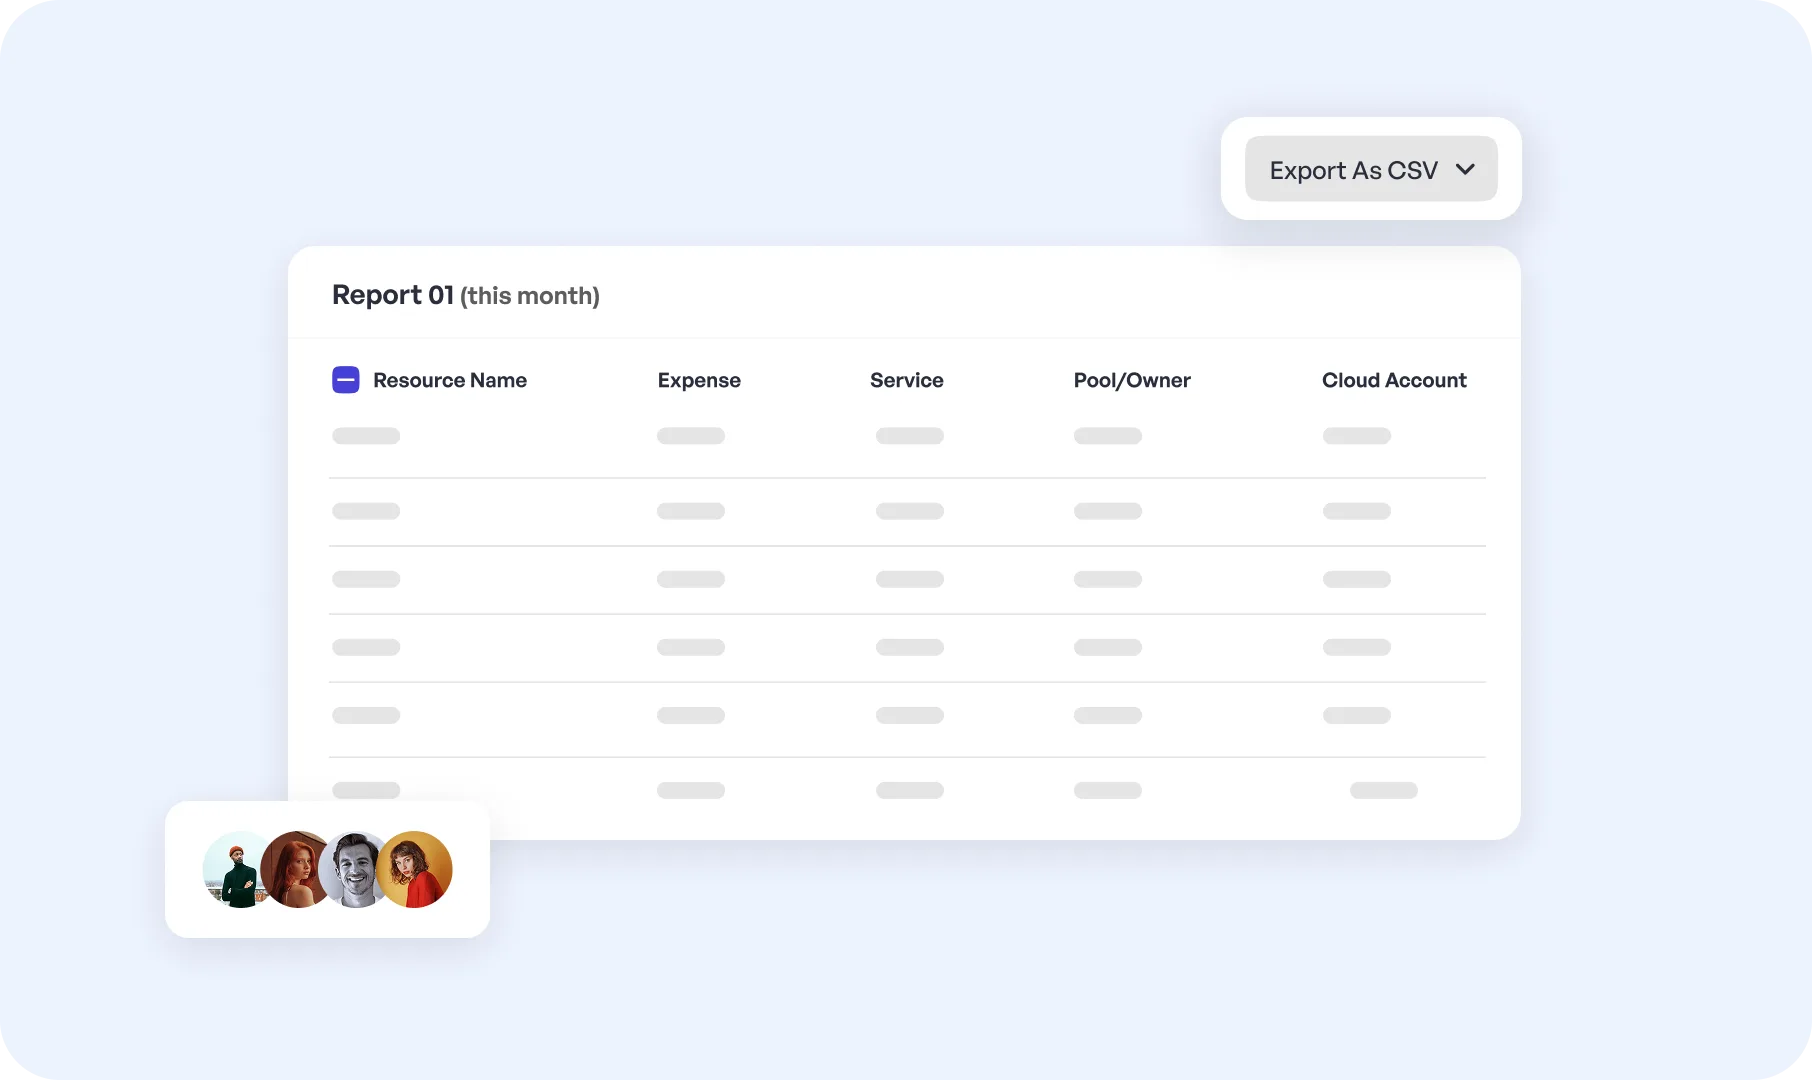
View a breakdown of tagged vs. untagged spend and instantly get a Tag Compliance Score to find resources with missing key/value pairs. How back or charge back 100% of your cloud spending to the undertaking teams and business departments. You can get a full, searchable list of your cloud resources to locate and delete your unused cloud resources, such as instances under terminated-but-charged status.

Governace

Automate and Customize Your Reporting

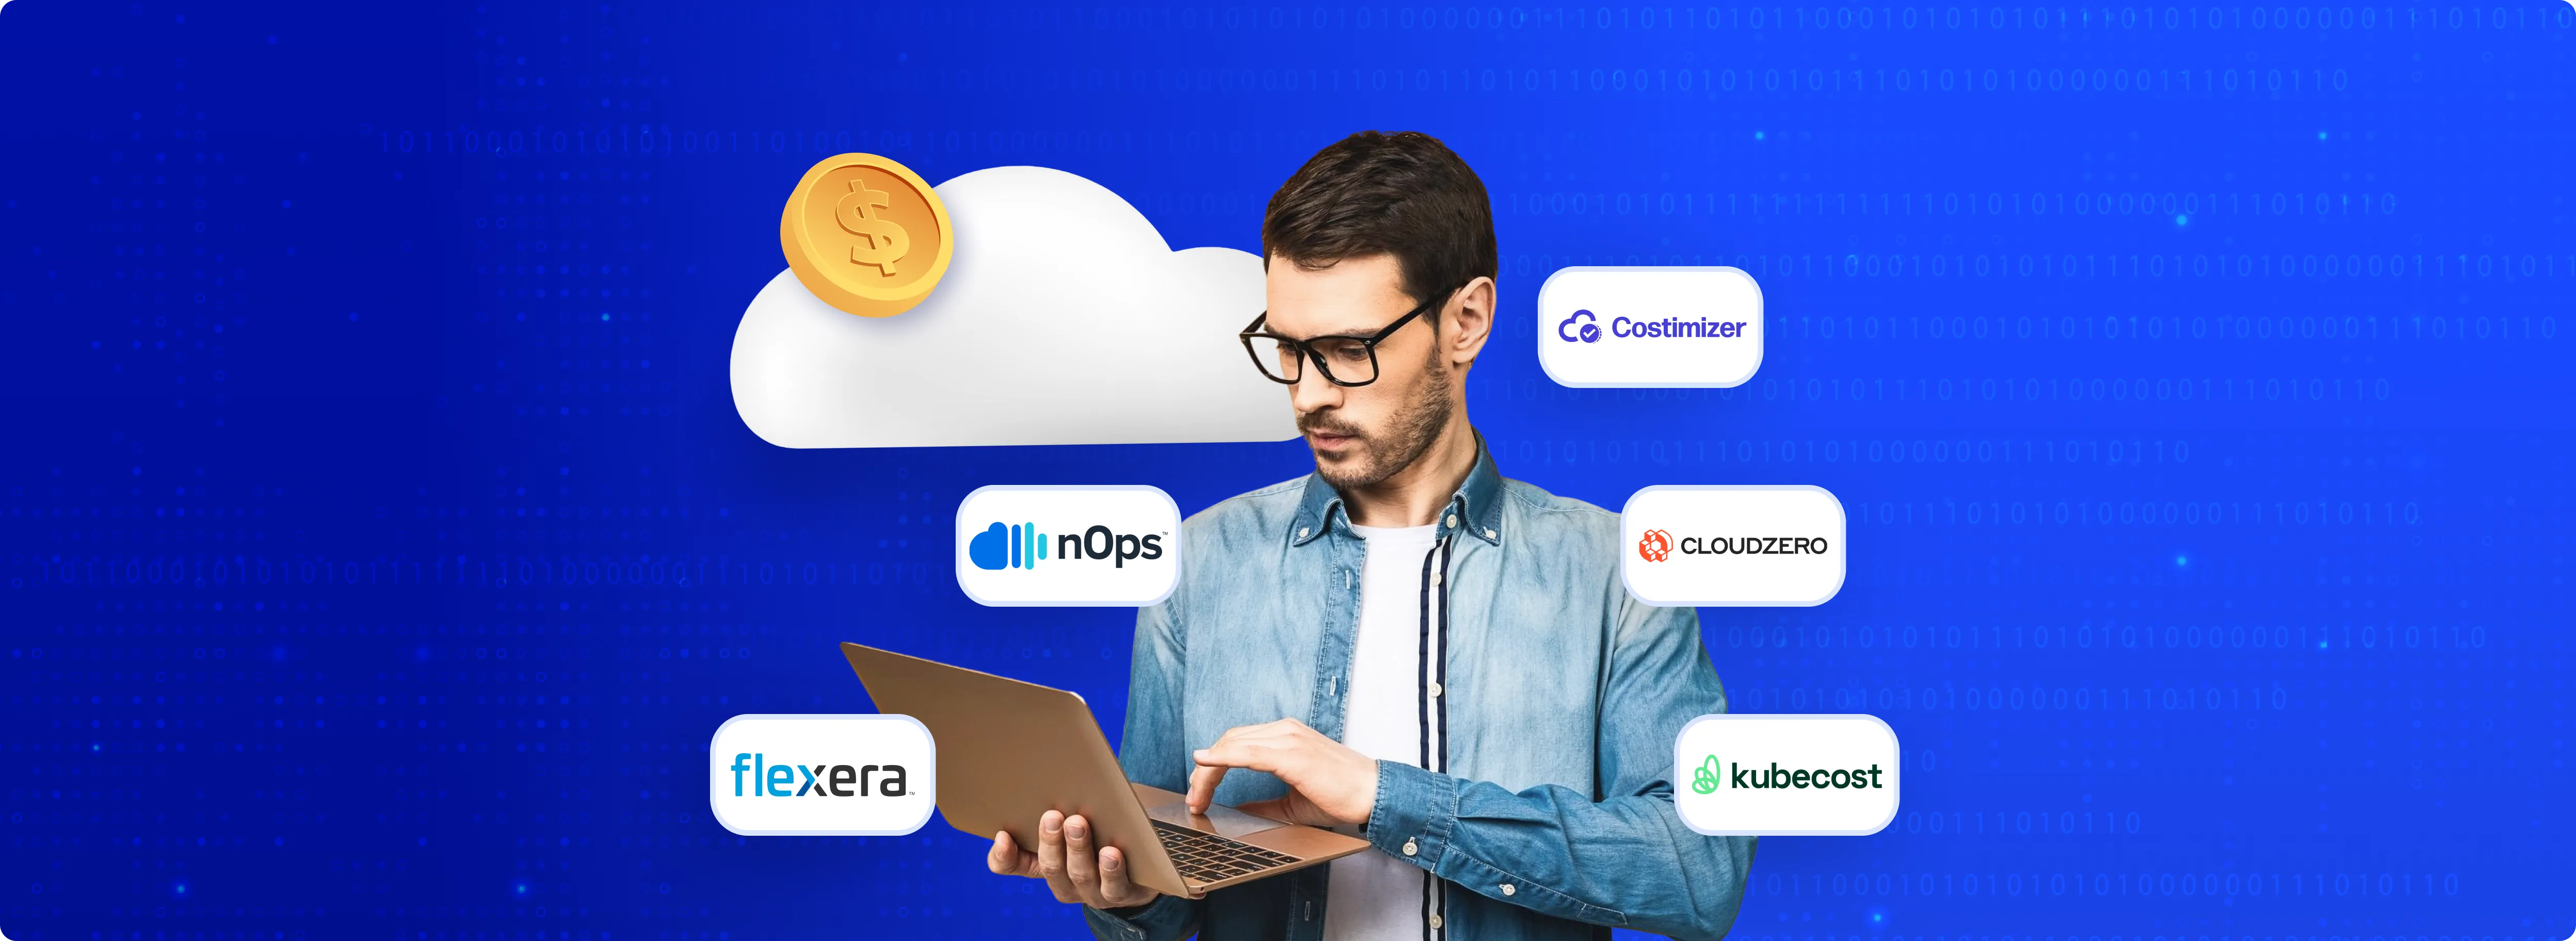
We provide a head start with our ready-made dashboards, but you can make them custom to your requirements. Build the ideal view, and have our cloud cost optimization tool play on autopilot.

Any already built report can be used as a template, and then easily cloned and adjusted to fit your own requirements.
Automatically schedule any dashboard to email or Slack important stakeholders a FinOps Report (PDF or CSV).
Role-based access to data involves sharing dashboards with team members, ensuring they have access only to relevant data.
Automate

Most viewed article

Cloud Cost Optimization in 2026: 15+ Strategies to Reduce Your AWS, Azure, GCP Bills
Cloud Cost Optimization

Cloud Cost Optimization in 2026: 15+ Strategies to Reduce Your AWS, Azure, GCP Bills

Chandra
Chandra
15 Minutes Read • Dec 29, 2025
Azure Cost Management & Optimization: The Complete Guide
Azure

Azure Cost Management & Optimization: The Complete Guide

Sourabh Kapoor
Sourabh Kapoor
12 Minutes Read • 08/10/2025
Cut AWS Costs in 2026: Pricing, Tools & Best Practices Explained
AWS

Cut AWS Costs in 2026: Pricing, Tools & Best Practices Explained

Mohd. Saim- Devops Engineer
Mohd.Saim
14 Minutes Read • Jan 23, 2026
INTEGRATIONS

Costimizer works with the tools you use

From high-growth startups to global enterprises, leaders choose Costimizer to turn their cloud operations into a source of efficiency and innovation.

Explore All Integrations
github
gitlab
Bi
slack
jenkis
jira
calander
github
gitlab
Bi
slack
jenkis
jira
calander
github
gitlab
Bi
slack
jenkis
jira
calander
github
gitlab
Bi
slack
jenkis
jira
calander

CONNECT YOUR CLOUD ACCOUNT

Connect Now
AWS
Uncover hidden waste across all your AWS services. Connect in 60 seconds to see your personalized savings.Start with AWS
GCP
Azure
FAQ

Frequently Asked Questions (FAQs)

What are the supported cloud providers of these dashboards?

Our dashboards are multi-cloud-built. They are complete proponents of Amazon Web Services (AWS), Google Cloud Platform (GCP), and Microsoft Azure. The most interesting part is that the data is all in one place, and you can have a one-window view of all your cloud expenditure without having to switch between consoles of various vendors.

What is the frequency of updating the data in the dashboards?

We update the data daily, in line with the billing and usage data provided by your cloud providers. This ensures that you always make decisions using the latest and most accurate information on your costs and usage trends.

What about the pre-built dashboards that do not contain the precise view that is required?

It is easy to clone any dashboard and then tailor it to your specific needs. Adding, removing, or rearranging widgets is easy, and you can filter your data with various filters, allowing you to have the best of both worlds: out-of-the-box speed and custom flexibility.

What is the time to setup and know my data?

Setup is incredibly fast. All you have to do is link your cloud accounts via a secure and read-only role, which can be accomplished in a few minutes. Upon the connection, the dashboards will start to fill with your data automatically. You will be able to go through the setup to insights on the same day.

Can I share this Cloud Reporting Dashboard with my team?

Absolutely. Any dashboard can be automatically sent as a PDF or CSV file to any stakeholder via email or Slack. To access live, you can safely establish a connection to a particular dashboard, and our role-based access controls can guarantee that every individual only sees the information that is pertinent to their position.
CONTACT US

Learn how Costimizer can help you save millions of dollars on your cloud bills

Having delivered value from Day 1, customers have literally texted us that we could charge them, but Costimizer continues to be a free product for our customers


costimizer-logo
Features
Cloud Cost Management
Pools (Cost Allocation)
Cloud Reporting
Kubernetes Cost Optimization
Cloud Tag Management
View All

Contact Info
img
IndiaA 80, A Block, Sector 2, Noida, Uttar Pradesh 201301
img
For Business Inquiriessales@costimizer.ai
img
USA
5637 Melodia Circle,Dublin, CA 94568
img
For Support Inquiriescontact@costimizer.ai

© 2025 Costimizer | All Rights Reserved
Back To Top