A recent survey by the Cloud Native Computing Foundation revealed a hard truth: 68% of organizations saw their Kubernetes costs increase over the past year.
Business leaders are losing money because they cannot see what they are paying for. When you cannot connect a cloud expense to a specific product, team, or customer, you cannot calculate your true profit margins. You’re flying blind.
This blog breaks down exactly why Kubernetes messes up traditional cloud billing. We'll show you everything about Kubernetes cost allocation: pods, namespaces, and labels. Plus, we'll introduce you to smart AI cloud cost-saving tools like Costimizer that actually fix the problems for you.
60-Second Summary:
Before containers became popular, cloud billing was simple. You rented one virtual machine (a server). You put one application on that server. When the cloud bill arrived, it clearly stated the cost of that specific server.
Kubernetes breaks this clean system. It introduces three major problems that hide your true expenses.
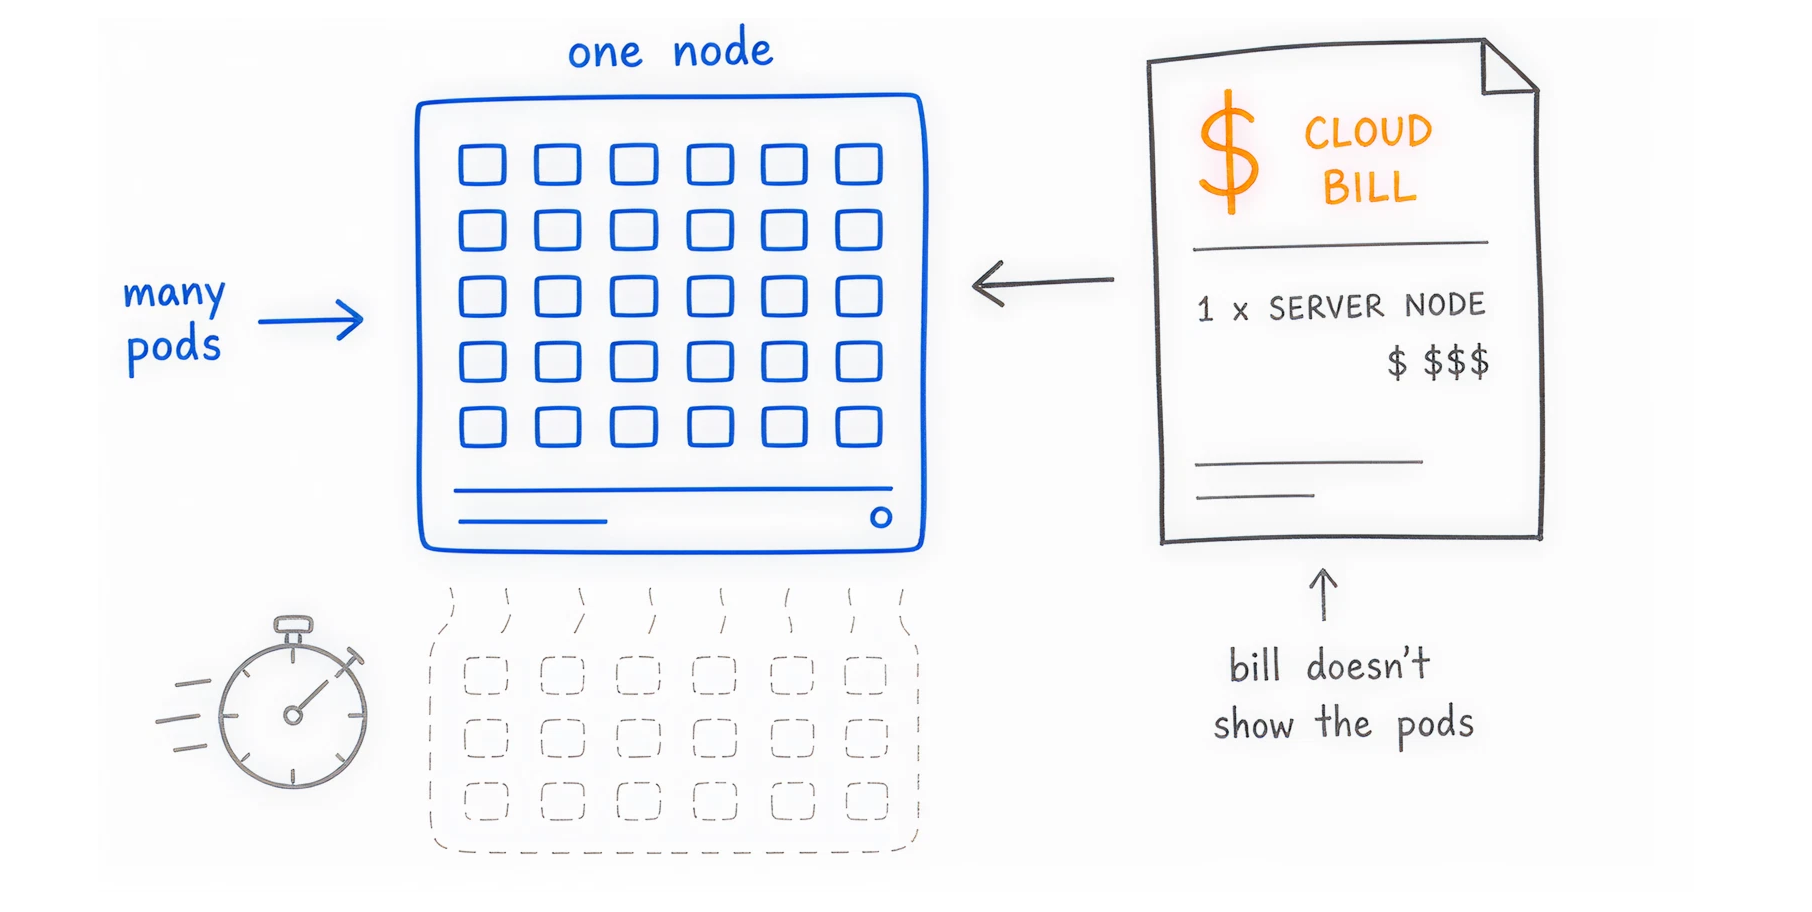
Kubernetes is designed to pack many small applications together to save space. A single cloud server, called a node, might run 50 different applications. These applications, called pods, might belong to five different departments.
Your cloud provider (AWS, Azure, or Google Cloud) only bills you for the underlying node. They charge you for the server, not the 50 applications running inside it. When the invoice arrives, finance sees a $1,000 charge for a server, but they have no idea which team spent the money. This makes financial accountability impossible.
Containers are temporary by design. If your e-commerce website gets a surge of traffic, Kubernetes will automatically create new pods to handle the load. When traffic drops, Kubernetes destroys those pods 10 minutes later.
Tracking the exact cost of a resource that existed for only ten minutes is a huge data challenge. If you rely on monthly billing reports, that data is already lost. You cannot optimize a system if the resources disappear before you measure them.
Engineers on forums frequently discuss a specific data headache called the "Double Fracture."
AWS introduced Split Cost Allocation Data (SCAD) to help track pod costs. SCAD works well for computing costs, but it breaks your standard tagging system.
Here is the problem: If you tag a Kubernetes pod, AWS puts that tag in a billing column called split_line_item. But if that same application uses an Amazon RDS database, AWS puts the database tag in a different column called resource_tags.
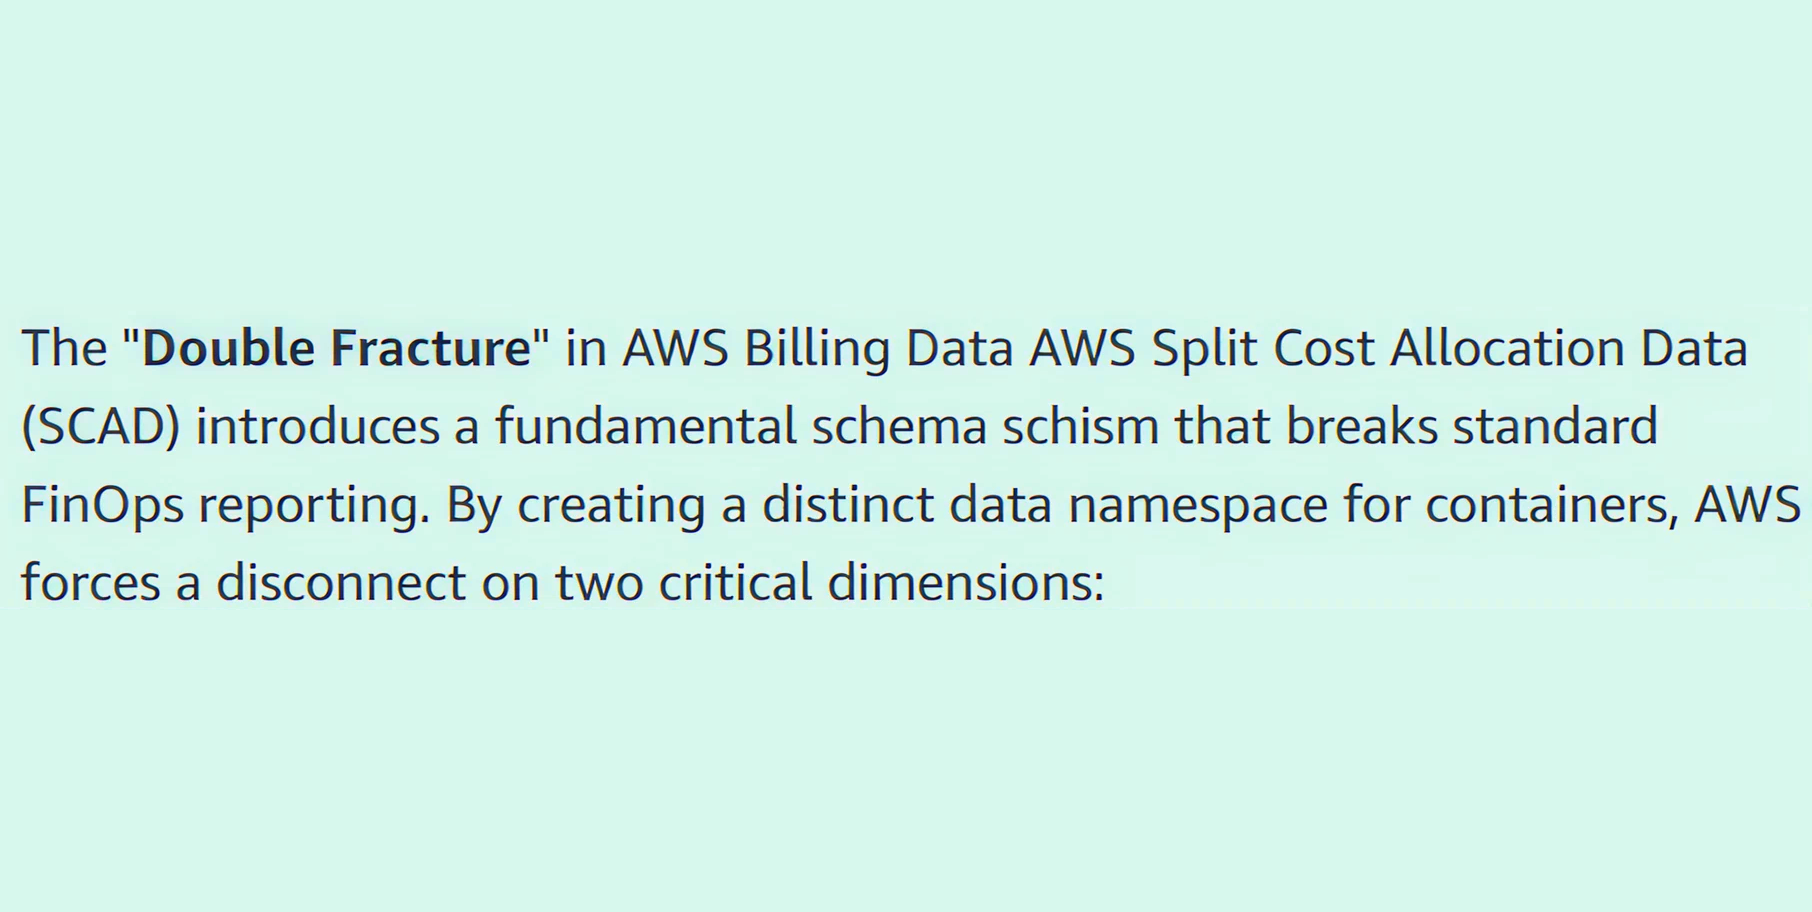
Your database and application costs are fractured. If a CFO wants to know the total cost of an entire application, they cannot simply filter the bill. A data engineer must write complex SQL queries in Amazon Athena to manually combine columns. This wastes expensive engineering time just to read a bill.
To figure out who spent what, you have to choose a mathematical model. You must decide how to split the server's cost among the pods running on it.
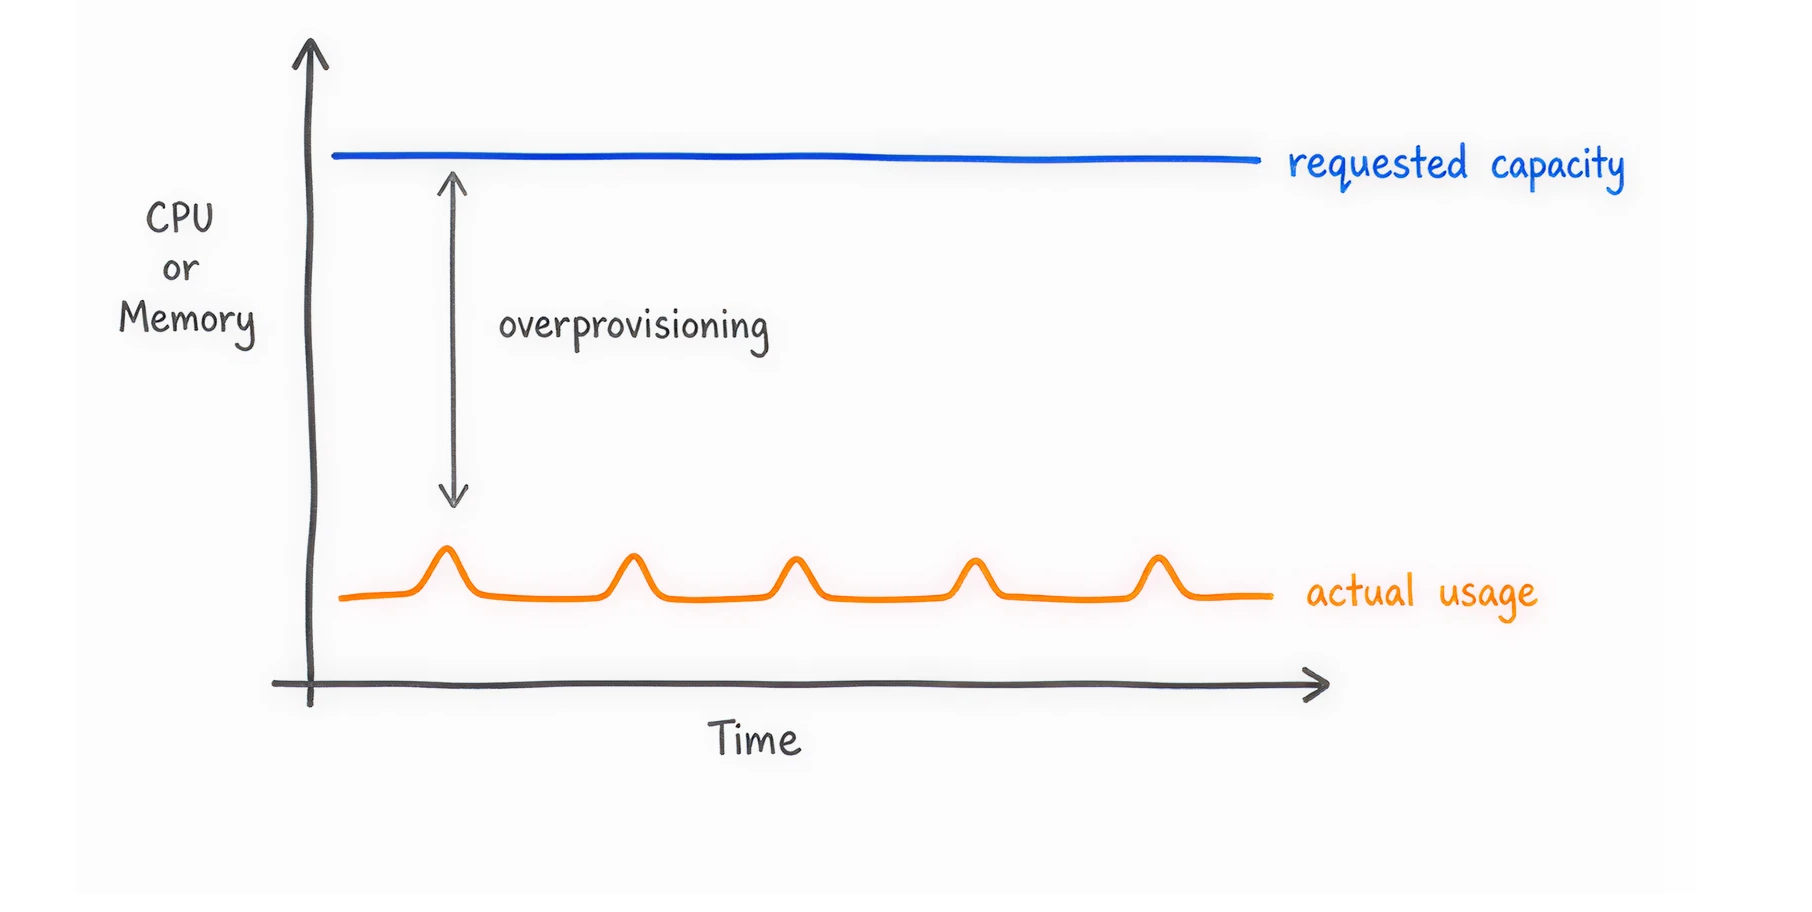
Every pod in Kubernetes has two metrics: what it asks for (requests) and what it actually uses (usage). You must choose which metric to use for billing.
Allocation by Resource Requests: When developers launch an application, they request a specific amount of CPU and memory.
Allocation by Actual Usage: This model tracks the exact telemetry data of what the application burns in real time.
Most successful enterprises start with Resource Requests to force good habits, then move to Actual Usage as their FinOps practices mature.
A major problem shared by FinOps experts is the idle space.
Imagine you rent a server with 64 CPUs for $1,000 a month. Your teams deploy pods that request a total of 48 CPUs. You have 16 CPUs sitting completely empty.
Who pays for the 16 empty CPUs?
If you only bill teams for the 48 CPUs they used, your finance team has to cover the missing money. This is cloud waste. You must explicitly surface this unallocated capacity.
The best practice is to allocate the cost of idle space proportionally to teams based on their size. This forces engineering leaders to care about total system efficiency, not just their own applications.
Not every application belongs to a specific team. Every Kubernetes cluster has shared services. These include security tools, logging agents like Datadog, and network routers (Ingress controllers).
If your shared logging tool costs $5,000 a month, how do you bill your internal teams?
The big cloud providers have native tools to help track these costs. Setting them up requires technical effort, but it's totally worth it.
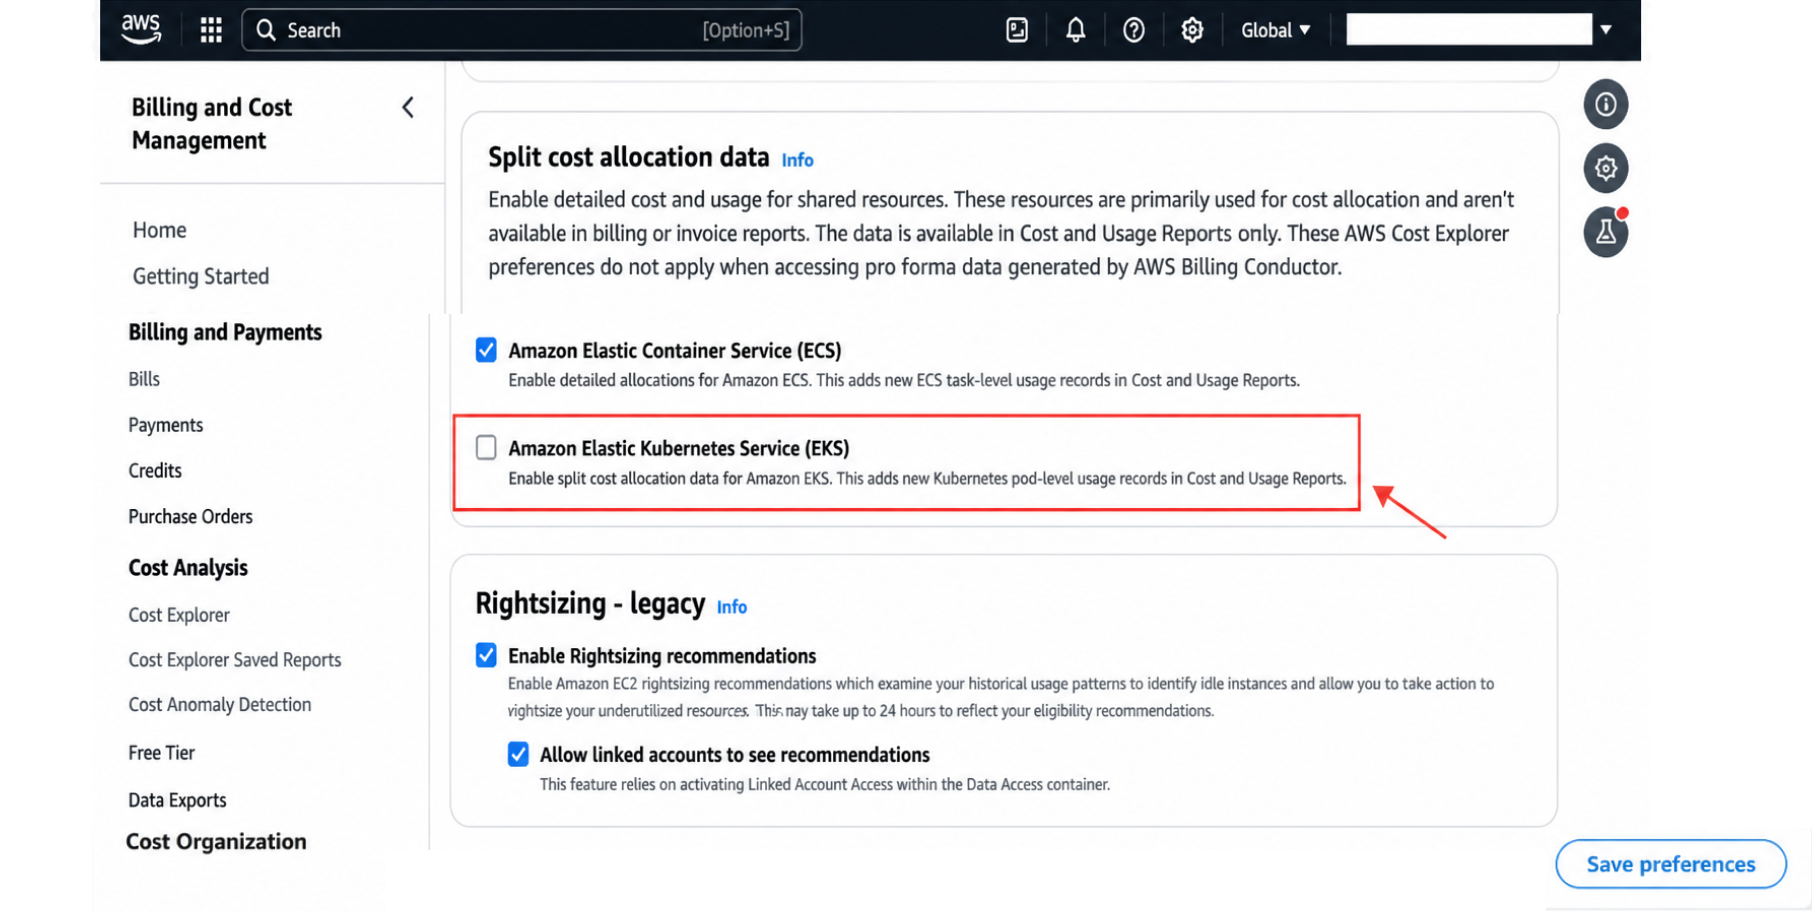
If you use AWS, you must enable SCAD to see pod-level costs.
Once enabled, AWS will scan your Kubernetes labels and annotations. It will convert them into AWS cost allocation tags.
You can then use Amazon Athena to query this data and build dashboards. Be prepared to manage the "Double Fracture" problem mentioned earlier.
Artificial Intelligence workloads are incredibly expensive. Renting an Nvidia GPU instance can cost thousands of dollars a month.
Previously, if you ran 10 different Machine Learning models on one shared GPU server, you could not tell which model cost what. It was one enormous bill.
AWS recently released a feature allowing you to allocate the cost of shared EC2 instances with multiple accelerators down to the specific pod.
You can now see the exact return on investment (ROI) for each individual AI model. If you run AI workloads, you must enable this feature immediately to prevent budget drain.
Google Cloud handles Kubernetes billing very cleanly. You can enable GKE cost allocation directly in your cluster settings.
When enabled, Google extracts the namespace and label data from your workloads. It automatically sends this detailed data to your Google Cloud Billing BigQuery Export.
Your data teams can then use simple SQL queries in BigQuery to generate accurate reports showing exactly which namespace drove your costs.
Microsoft Azure offers native cost analysis directly in the Azure portal. You can filter your standard cost analysis views by Kubernetes namespace.
While Azure's setup is generally easier than AWS, it lacks some of the deep customization required for complex, multi-tenant chargeback models.
Technology alone will not lower your bills. You must change how your company thinks about cloud money. You need a system to hold people accountable.
Showback is the first step. You provide cost visibility to your engineering teams without making them actually pay the bill.
You show them a dashboard that says, ‘Your team spent $40,000 on Kubernetes this month.’
The goal of showback is awareness. It changes the conversation from ‘the cloud is expensive’ to ‘this specific feature costs too much to run.’
Chargeback is the final goal. You actively bill internal business units for their exact Kubernetes resource consumption. The money actually leaves their departmental budget. When a team's cloud bill directly impacts their ability to hire new staff, they suddenly care deeply about optimizing their code.
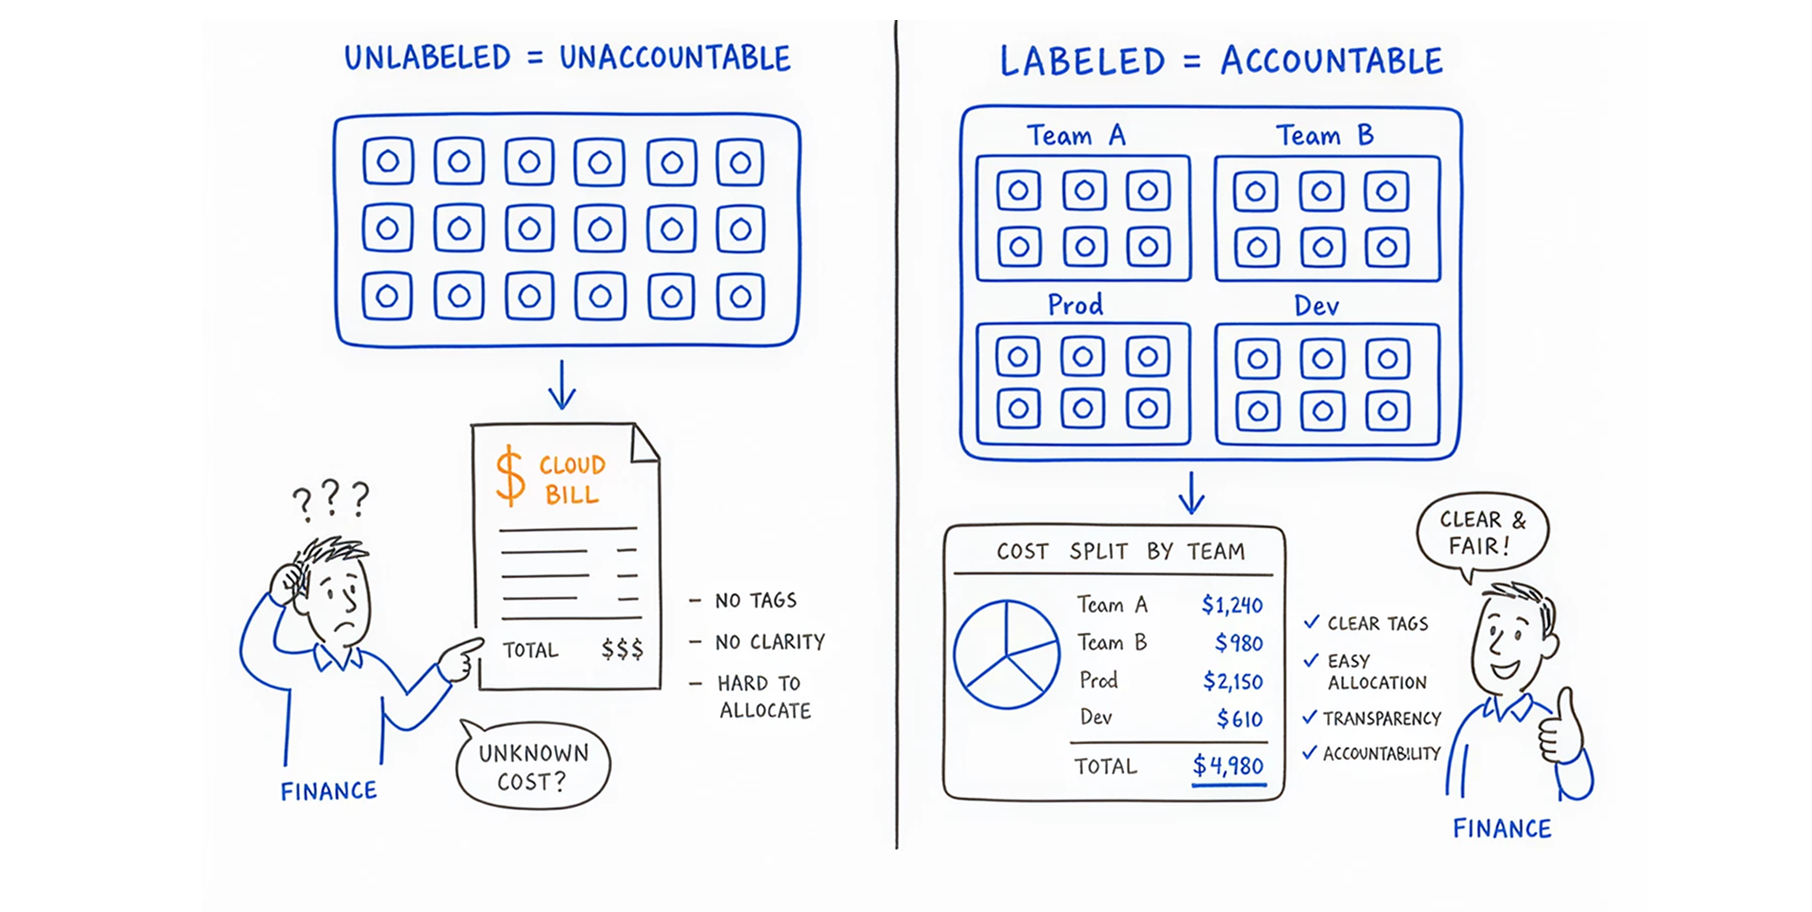
Showback and chargeback fail completely if your resources are not labeled. If a pod has no label, you do not know who owns it.
You must establish a strict labeling standard. You can enforce this using policy engines like Open Policy Agent (OPA) or Gatekeeper. These tools act as digital bouncers. If a developer tries to deploy an application without a "Team Name" and "Environment" label attached, the policy engine rejects the deployment. No tag, no deployment.
Alright, you've got the math and the culture down. Now you need the right software! Here is how to evaluate your options.
Tools like AWS CUR, AWS CUDOS dashboards, and GKE BigQuery are free to use. They are highly customizable.
The downside is that they require massive manual effort. Your data engineers will spend hundreds of hours writing SQL queries and maintaining dashboards instead of building your actual product. They also only show you the problems; they do not fix them.
Third-party tools such as Kubecost, OpenCost, and CloudBolt are excellent for improving visibility. They connect to your cluster and instantly show you granular insights. They solve the multi-cloud reporting problem.
However, a dashboard showing a $10,000 waste does not save you $10,000. An engineer still has to log in, read the chart, find the server, test the change, and turn the server off. which, let's be honest, rarely happens!
In 2026, dashboards are no longer enough. You need Agentic AI platforms like Costimizer that take action.
Costimizer does not just report on cloud waste; it fixes it.
When you use an execution platform, you stop asking engineers to do accounting. The system manages the money so the engineers can write code.
If you want to cut 30% of your cloud bill this week, follow these five exact steps.
We repeat this because it is the most common failure point. Never deploy an application without mandatory namespace and pod labels. Use automated tagging tools to scan your environments and tag orphaned resources.If you cannot identify it, you cannot optimize it, which is why every engineering team should follow a proper kubernetes cost optimization guide.
Do not rely on developers assuming how much memory they need. They will always guess high to prevent crashes. Use automated tools to adjust CPU and memory requests based on historical usage. Let the machines calculate the exact limit required to maintain performance without wasting money.
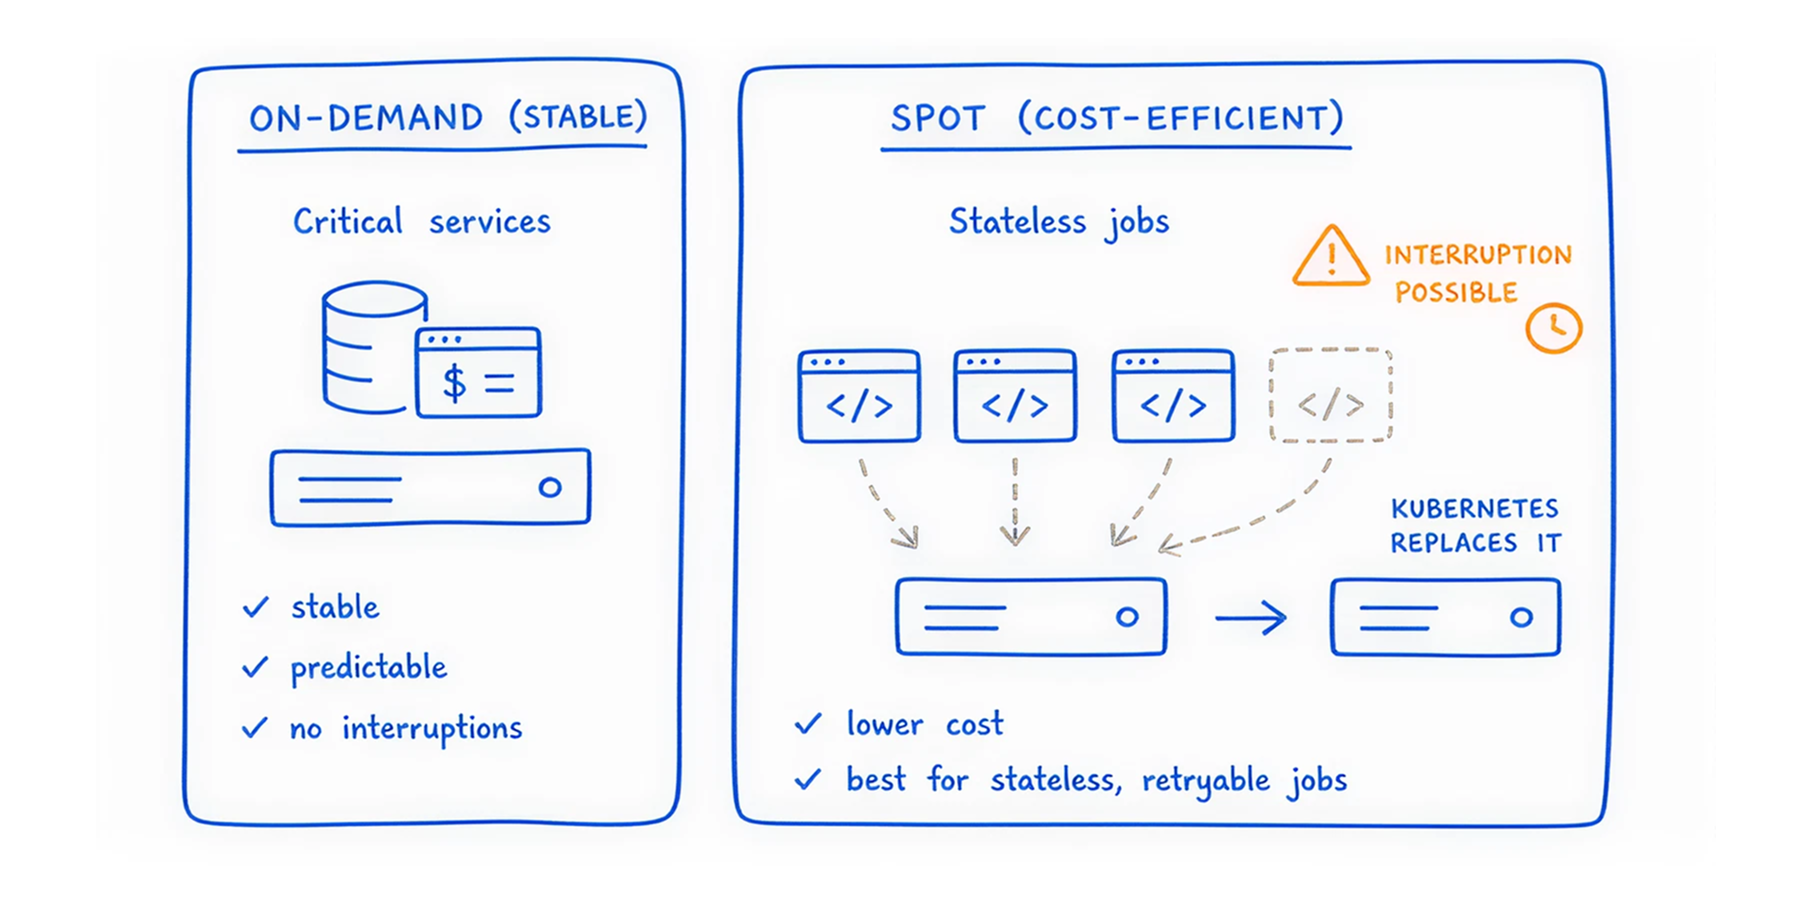
Cloud providers rent out their spare server capacity at massive discounts (up to 90% off), known as Spot Instances. The catch is that they can take the server back with a two-minute warning. If you have fault-tolerant, stateless background jobs, run them on Spot Instances. It is the single largest cost reduction lever available.
Don't wait for the monthly bill to arrive. Plug cost-estimation tools directly into your deployment pipeline. When a developer submits a code change, the tool should automatically flag it if it will increase the bill by $400 per month. Catch those mistakes before they go live!
Ensure your cluster autoscalers are efficiently packing pods onto the minimum required number of nodes. If you have five servers running at 20% capacity, you are wasting money.
You should have one server running at 100% capacity. Tools like Costimizer help manage node scheduling to eliminate empty server space.
Kubernetes cost allocation is complex because the cloud was built to sell servers, not to track individual applications. Tracking spend by pod, namespace, and label requires overcoming the 1-to-1 mapping failure, explicitly managing idle capacity, and enforcing strict labeling rules.
If you rely on basic dashboards, you will continue to lose 30% of your budget to cloud waste. You will spend hours debating who owns a specific invoice line item.
You need a system that does the work for you. Costimizer is an Agentic AI platform built to execute savings. It provides unified multi-cloud visibility, automatically enforces budgets, and safely rightsizes your Kubernetes resources while you sleep.
Best part? You can connect your cloud accounts to Costimizer in 60 seconds and see your personalized savings plan immediately.
Not necessarily. Unless your cluster autoscaler is properly configured to scale down and remove the underlying empty nodes, your cloud provider will still charge you for the idle server space even after the pods are destroyed.
Costimizer uses an AI-driven feature called "Pools" that logically groups your resources across AWS, Azure, and GCP. This automatically bridges the gaps in your imperfect tagging, giving you instant cost visibility while you work on your tagging hygiene.
No, Costimizer is designed for zero friction and a minimal footprint. It securely connects via read-only cloud APIs and lightweight metrics integrations in just 60 seconds without impacting your cluster's performance.
To fairly split external database costs, you must combine your Kubernetes metadata with database-level metrics (such as active connections, query volume, or storage per tenant) to proportionally allocate the DB invoice to individual pods.
While native dashboards and standard FinOps tools only show you where your cloud waste is, Costimizer uses Agentic AI to actively fix it by autonomously executing rightsizing and scheduling optimizations.
Native cloud billing tools struggle with this because network traffic is tracked at the node or NAT gateway level. You need an advanced cost tool that correlates cloud network invoices with cluster-level flow logs to pinpoint exactly which pod caused the traffic spike.
It can if you only rely on historical averages. Safe rightsizing requires analyzing peak memory spikes (OOM risks) and ensuring your Horizontal Pod Autoscaler (HPA) is perfectly tuned to add pods instantly when traffic surges.
Absolutely. You can start Costimizer in a "recommendation-only" mode, where your engineers manually review and approve sizing changes, enabling autonomous execution only when your team is 100% confident in the AI.
•
CFO•
Articles